
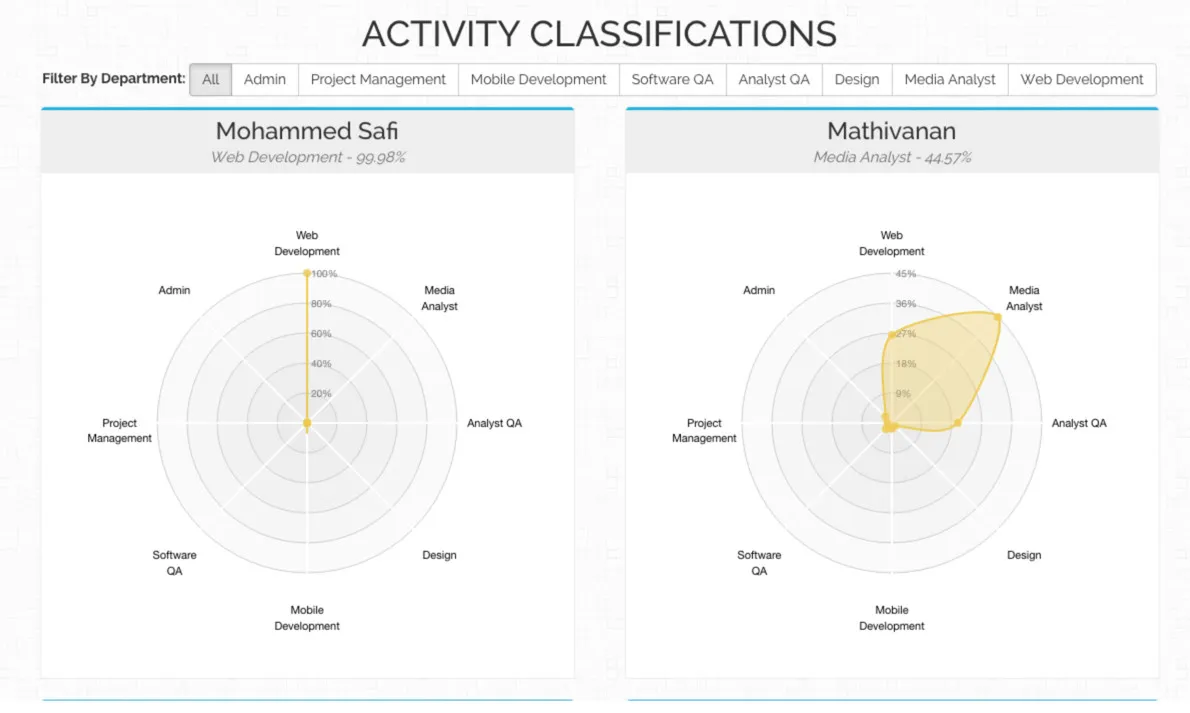
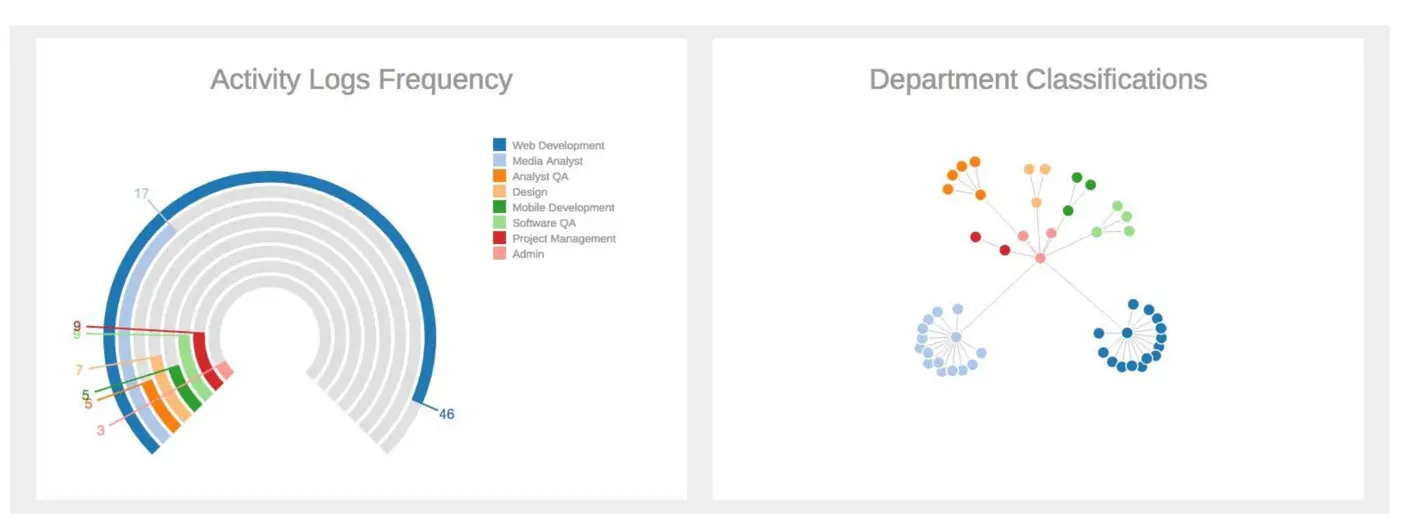
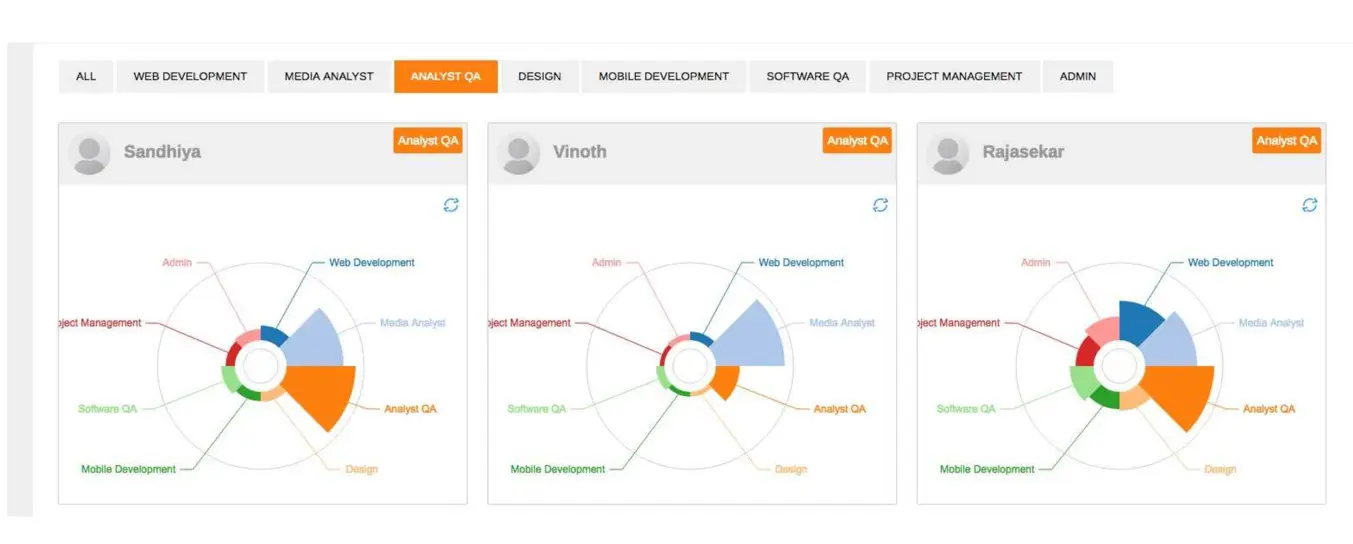
Team one : Classified the data with high accuracy and represented it using radial histograms.
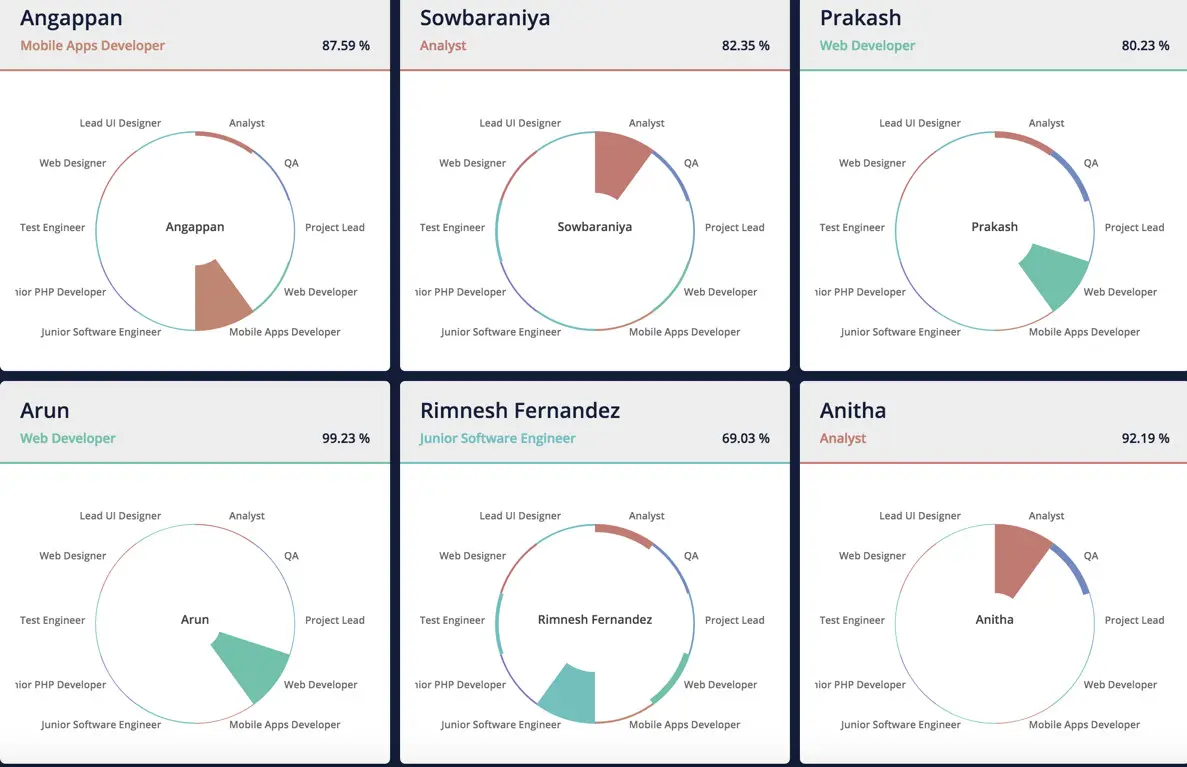
From team 1, only two people were incorrectly classified. The first person, it turned out the neural network was right and she was actually working as an analyst although we thought she was doing QA. The second person was out of tasks and hiding quietly. We had not realized, but the neural network did!
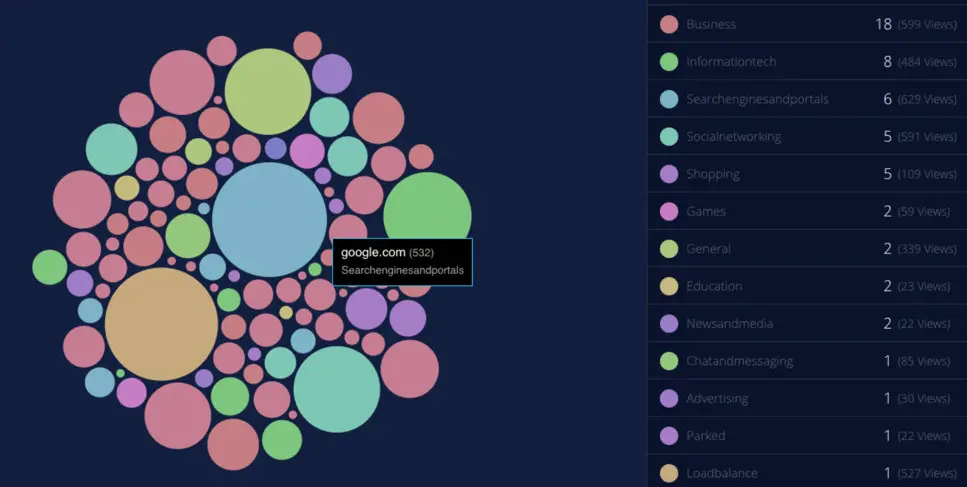
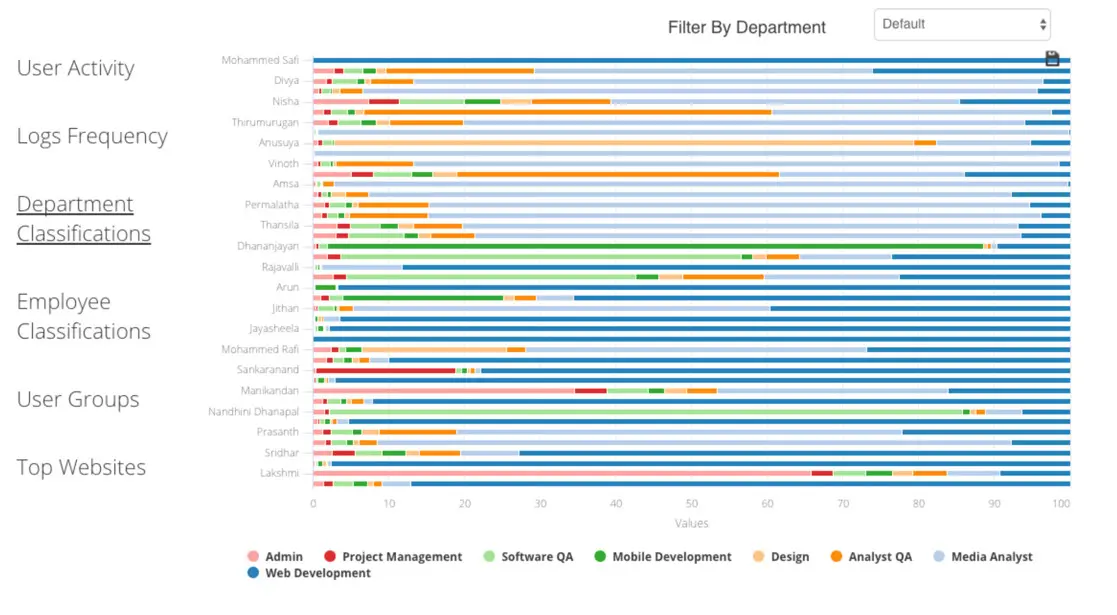
Team two: Created some of the most beautiful representations of the data and their classification network was both highly accurate and easy to read.
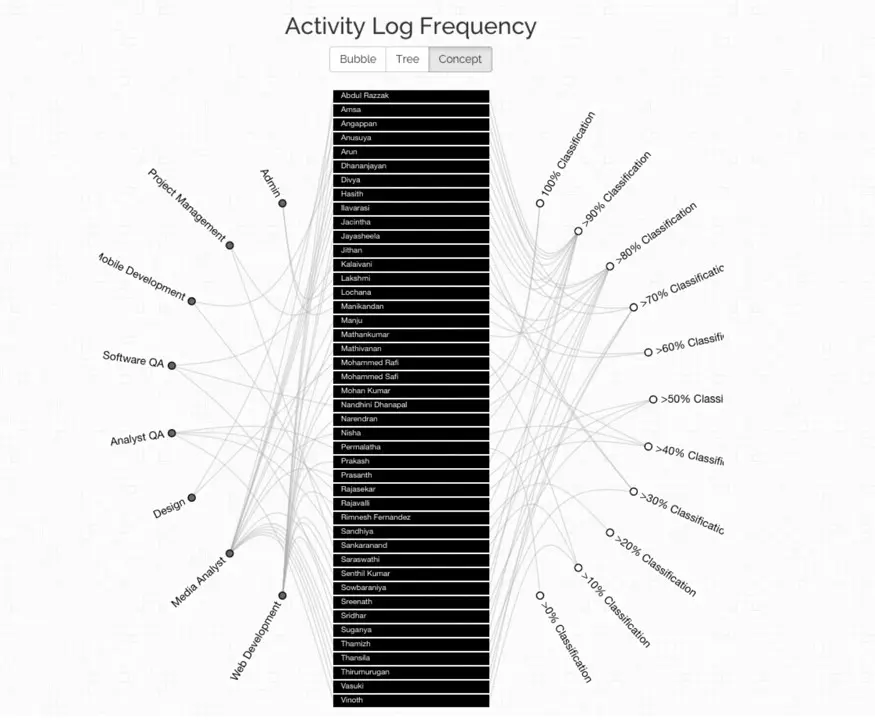
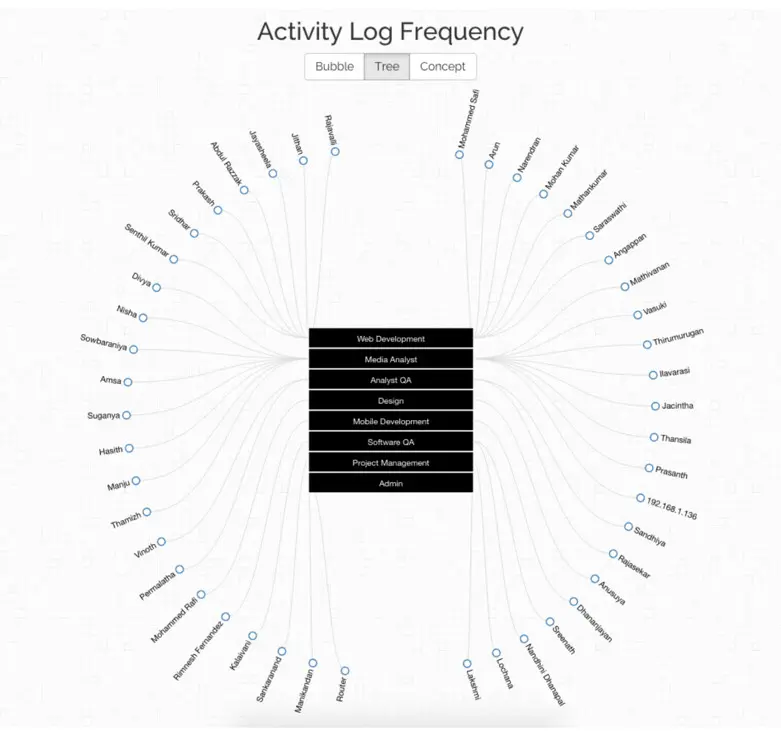
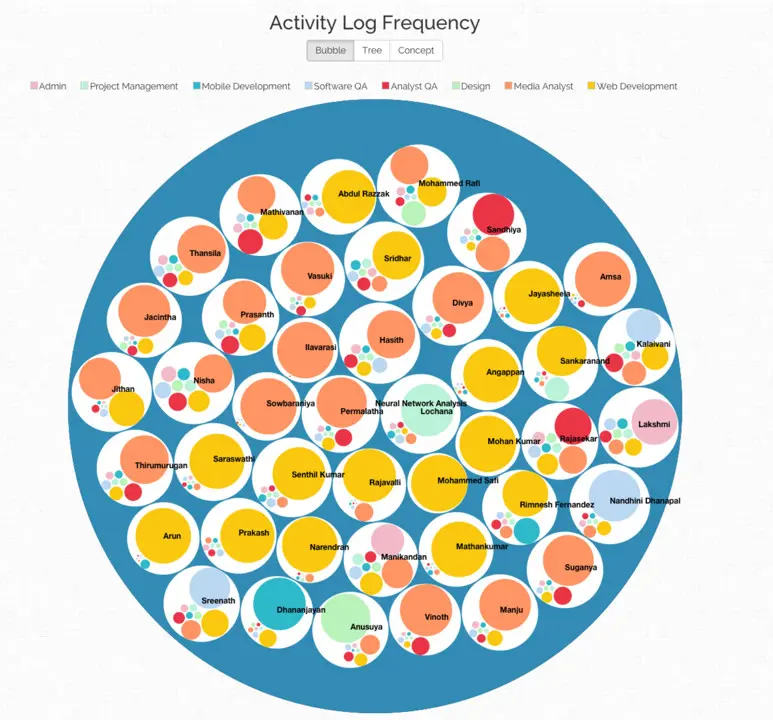
Team three: Created the easiest to follow information and had the most accurate Neural Net.
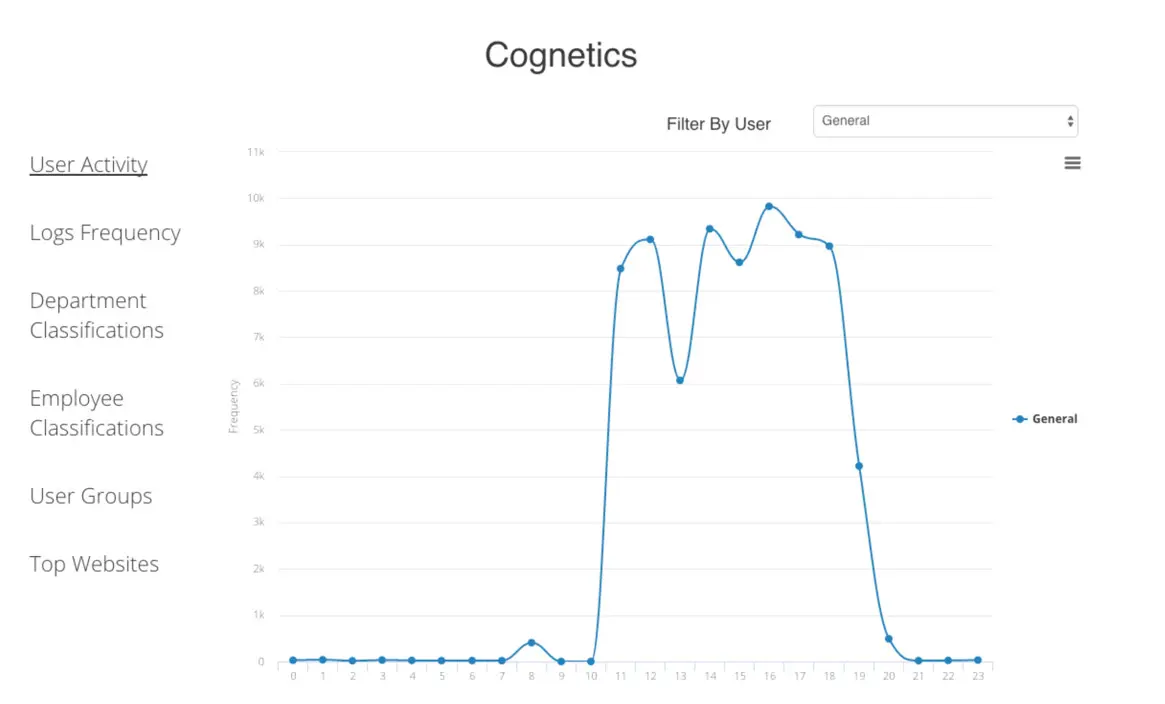
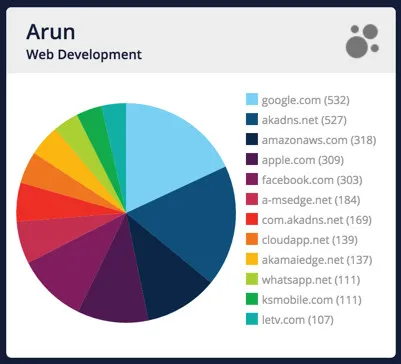
They also shone the brightest light on behaviour such as start and end of the active day and browsing of none work related sites. Which underlines the point it is not just managers who care who is putting the hours in. Hard working staff are also very conscious of who is and who is not pulling their weight — especially regarding senior management.
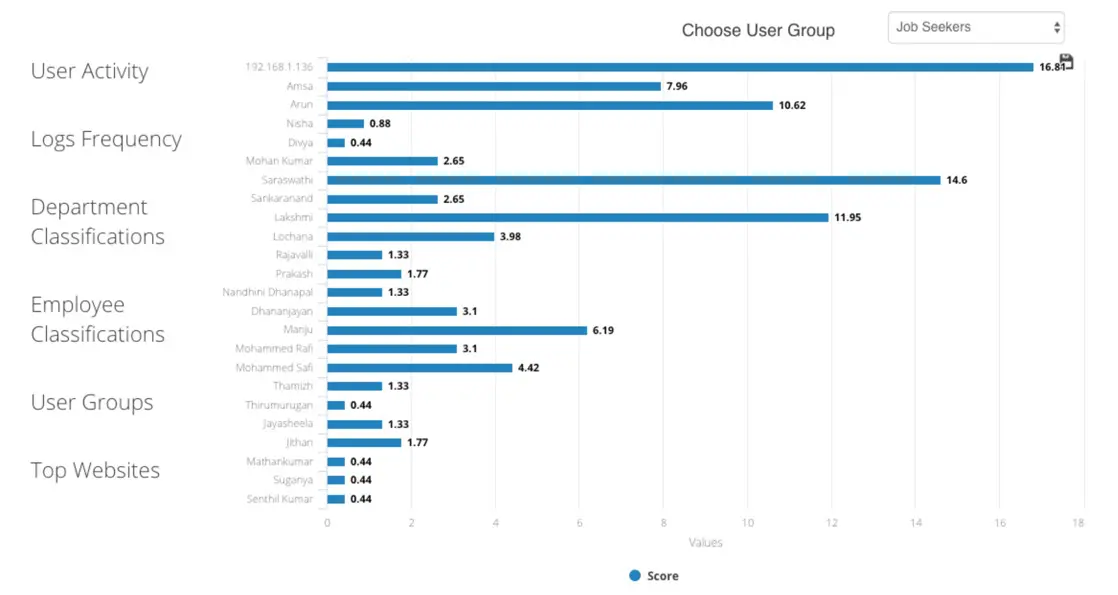
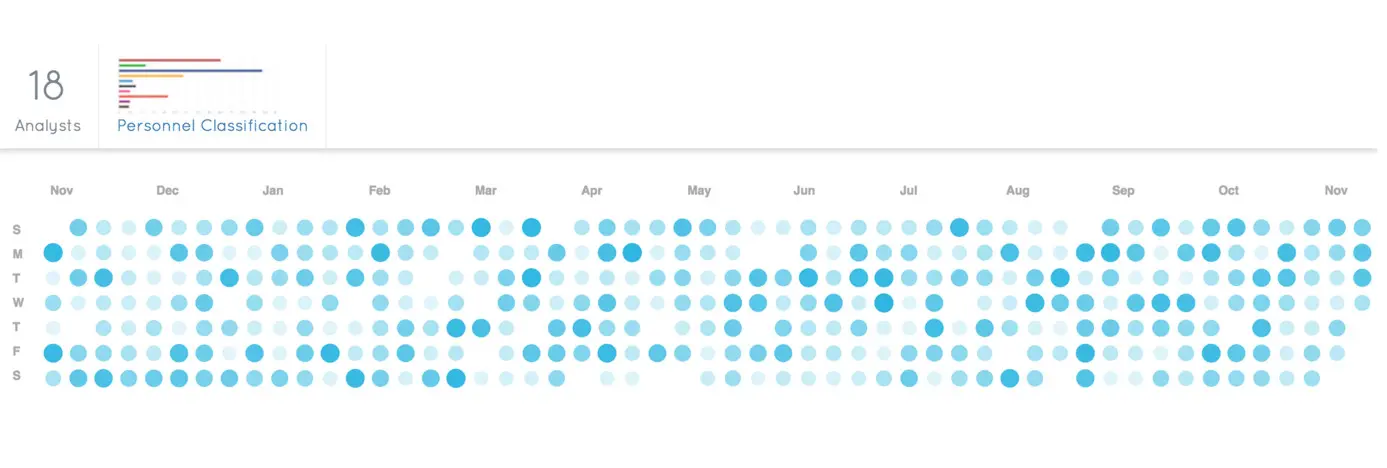
Team four: Took a long range view of the data, which was a real eye opener vs a simple 3 day snapshot and created a simple intuitive way to understand the information.
Team five: had never worked on AI before but were mobile experts and decided to turn their hands to this competition.
The results were beyond what any of us could have expected because they moved outside of the box in their representations
We were left with an impossible choice for judging the winners.
At the end of this, what is fascinating is the use of AI to discover who is not behaving as we expect, which can have many reasons
Over achievers
Under achievers
Working / acting outside their remit (malicious / unintentional)
The next challenge for the team is scaling this, from being able to track a small company to being able to track and represent tens or even hundreds of thousands of staff, and in a way that is still easy to visualise and drill down.
As companies grow it is not possible to know everyone individually, but using a dedicated neural network for that task can provide a powerful solution to catching problems early, identifying best potential and visualising staff.
Some final notes, the teams will share a bonus from any future sales. Hats off and credits to
TEAM — 1 : Safi , Jon
TEAM — 2 : Manish, JJ
TEAM — 3 : Senthil, Sankar, Naren, Angu, Mathan, Prakash, Lochana
TEAM — 4 : Sridar, Rimz, Abdul, Nandini, Mohan, Anu, Kalai
TEAM — 5 : Arun, DJ, Rafi, Sheela, Jithan, Sreenath, Rajavali